The NEW Bitcoin Rainbow2023 Chart
Feel like buying Bitcoin? Go to Binance . Without KYC: MEXC
Click here if you want to read the full story behind the Bitcoin Rainbow Chart.
The Rainbow Charts are not investment advice! Past performance is not an indication of future results. You can not predict the price of Bitcoin with a rainbow! It is meant to be be a fun way of looking at the historical long term price movements, disregarding the daily volatility “noise”. There is no scientific basis underpinning it.
Crypto T-Shirts with subtle designs
T-Shirts designed for everyday wear, flying under the radar of nocoiners while signaling to those who understand.
How does the new Rainbo2023 model work?
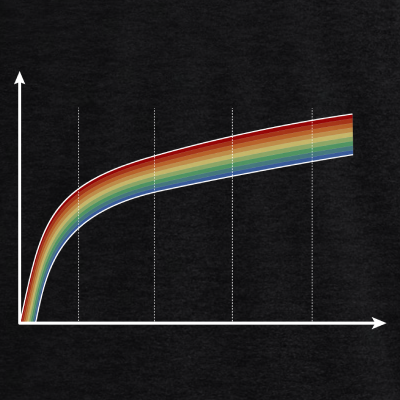
We fitted two curves. One that is the best fit for all of Bitcoin highs (red) and one that includes only the lows (blue). The rest we just interpolated. The result is this beautiful rainbow that will hopefully have a brighter future than the old one. As you can see, even in the new model we are in the lowest “Fire Sale” band, so fingers crossed!
If you have any questions, feel free to hit me up on Twitter or contact our PR Department.
So, what’s new?
- The Rainbow Chart V2 is based on a completly new formula, fitted with data until 2022
- The new fit explains every move so far (the old one had a couple of wicks outside the rainbow)
- But due to the recent events the potential trajectory for the Bitcoin Price is not as bullish as the old one
- You can now zoom and pan into the chart as you like
- You can add more years to the rainbow chart
What hasn’t changed?
- We kept the legend labels and the colors (still no indigo)!
- The rainbow is still not a full rainbow that goes back down, because that is not how Bitcoin works!
Here is the Ethereum Rainbow Chart


